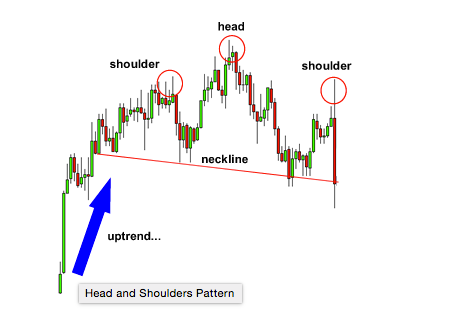
Head and Shoulders Downtrend
A head and shoulders pattern is also a trend reversal formation. It is formed by a peak (shoulder), followed by…
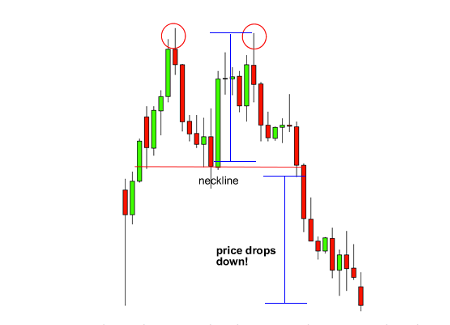
Double Top DownTrend
A double top is a reversal pattern that is formed after there is an extended move up. The “tops” are…
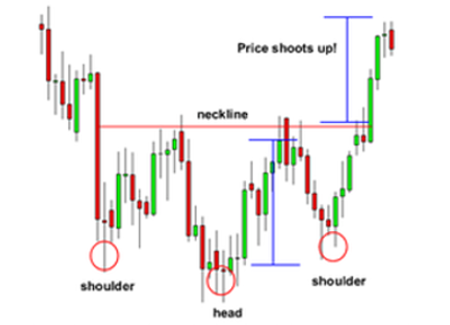
Head and Shoulders Uptrend
The name speaks for itself. It is basically a head and shoulders formation, except this time it’s upside down. A…
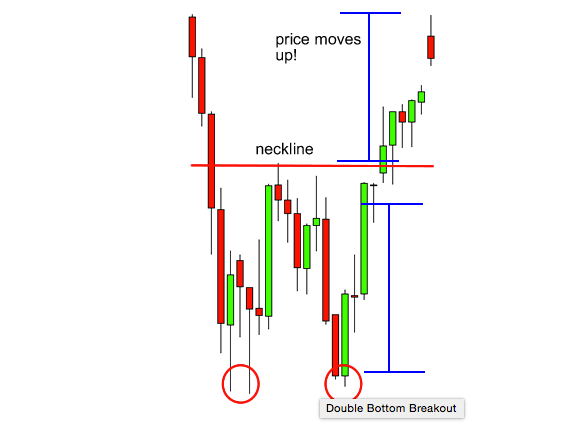
Double Bottom UpTrend
The double bottom is also a trend reversal formation, but this time we are looking to go long instead of…
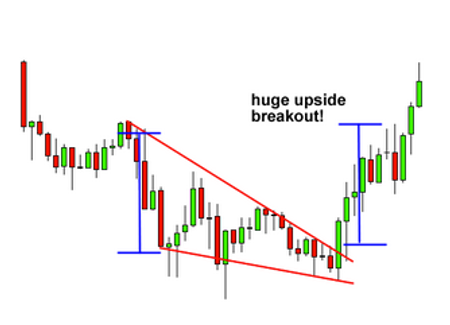
Bearish Wedge
See how the price made a nice move down, that’s the same height as the wedge? What did we learn…
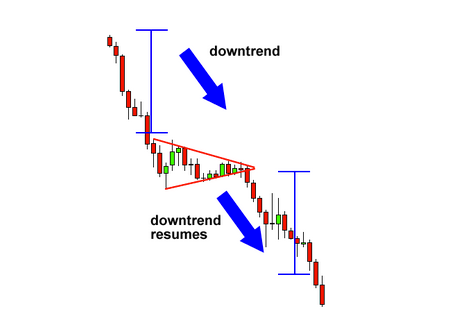
Bearish Pennants
Like rectangles, pennants are continuation chart patterns formed after strong moves. After a big upward or downward move, buyers or…
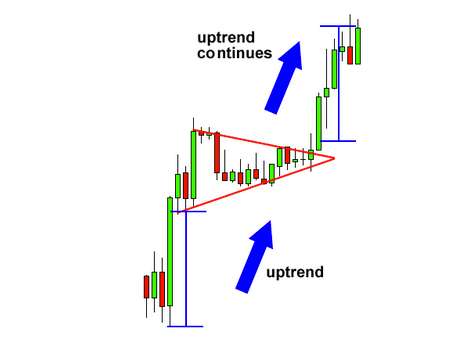
Bullish Pennants
Bullish pennants, just like the name suggests, signals that bulls are about to go a-chargin’ again. This means that the…
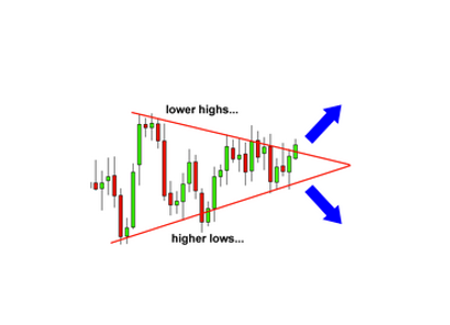
Symmetrical Triangles
A symmetrical triangle is a chart formation where the slope of the price’s highs and the slope of the price’s…
Descending Triangles
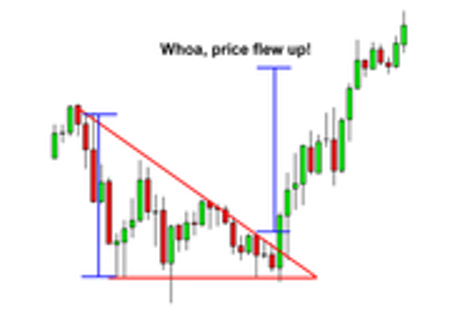
As you probably guessed, descending triangles are the exact opposite of ascending triangles (we knew you were smart!). In descending…
Rising Wedge
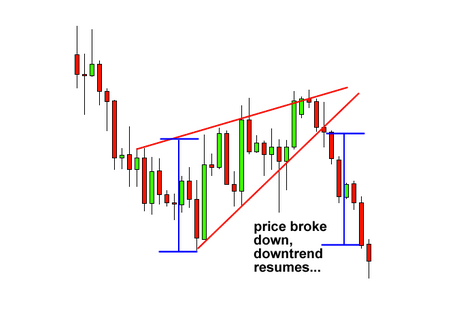
A rising wedge is formed when price consolidates between upward sloping support and resistance lines. Here, the slope of the…
Rectangles
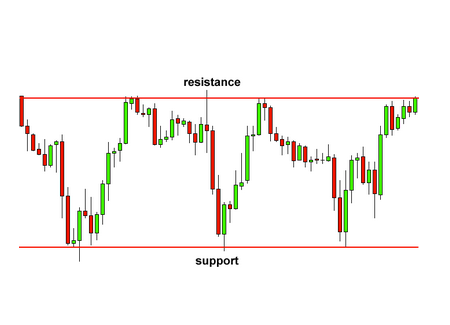
A rectangle is a chart pattern formed when price is bounded by parallel support and resistance levels. A rectangle exhibits…
Bearish Rectangle
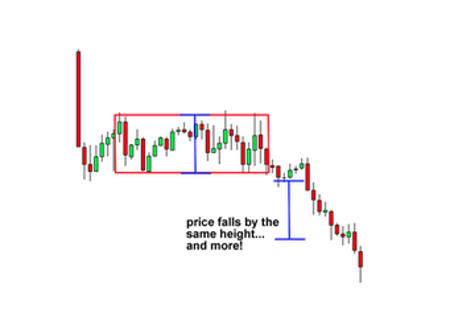
A bearish rectangle is formed when the price consolidates for a while during a downtrend. This happens because sellers probably…
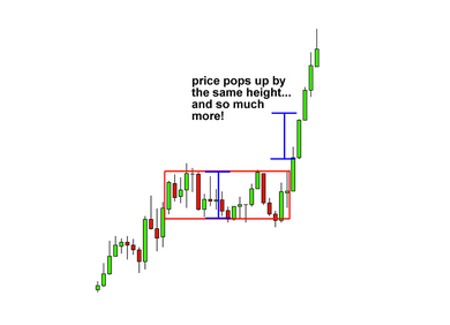
Bullish Rectangle
Here’s another example of a rectangle, this time, a bullish rectangle chart pattern. After an uptrend, the price paused to…
About Instructor



Responses